
Dans ce tutoriel, vous apprendrez à créer et à modifier des graphiques et des tableaux dans PowerPoint.
- Insérer un graphique
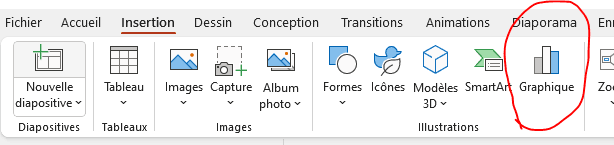
Pour insérer un graphique, cliquez sur l’onglet « Insertion » dans le ruban, puis sur « Graphique » dans le groupe « Illustrations ». Vous verrez une galerie de types de graphiques. Sélectionnez le type de graphique qui convient le mieux à vos données.
2. Saisir des données dans un graphique
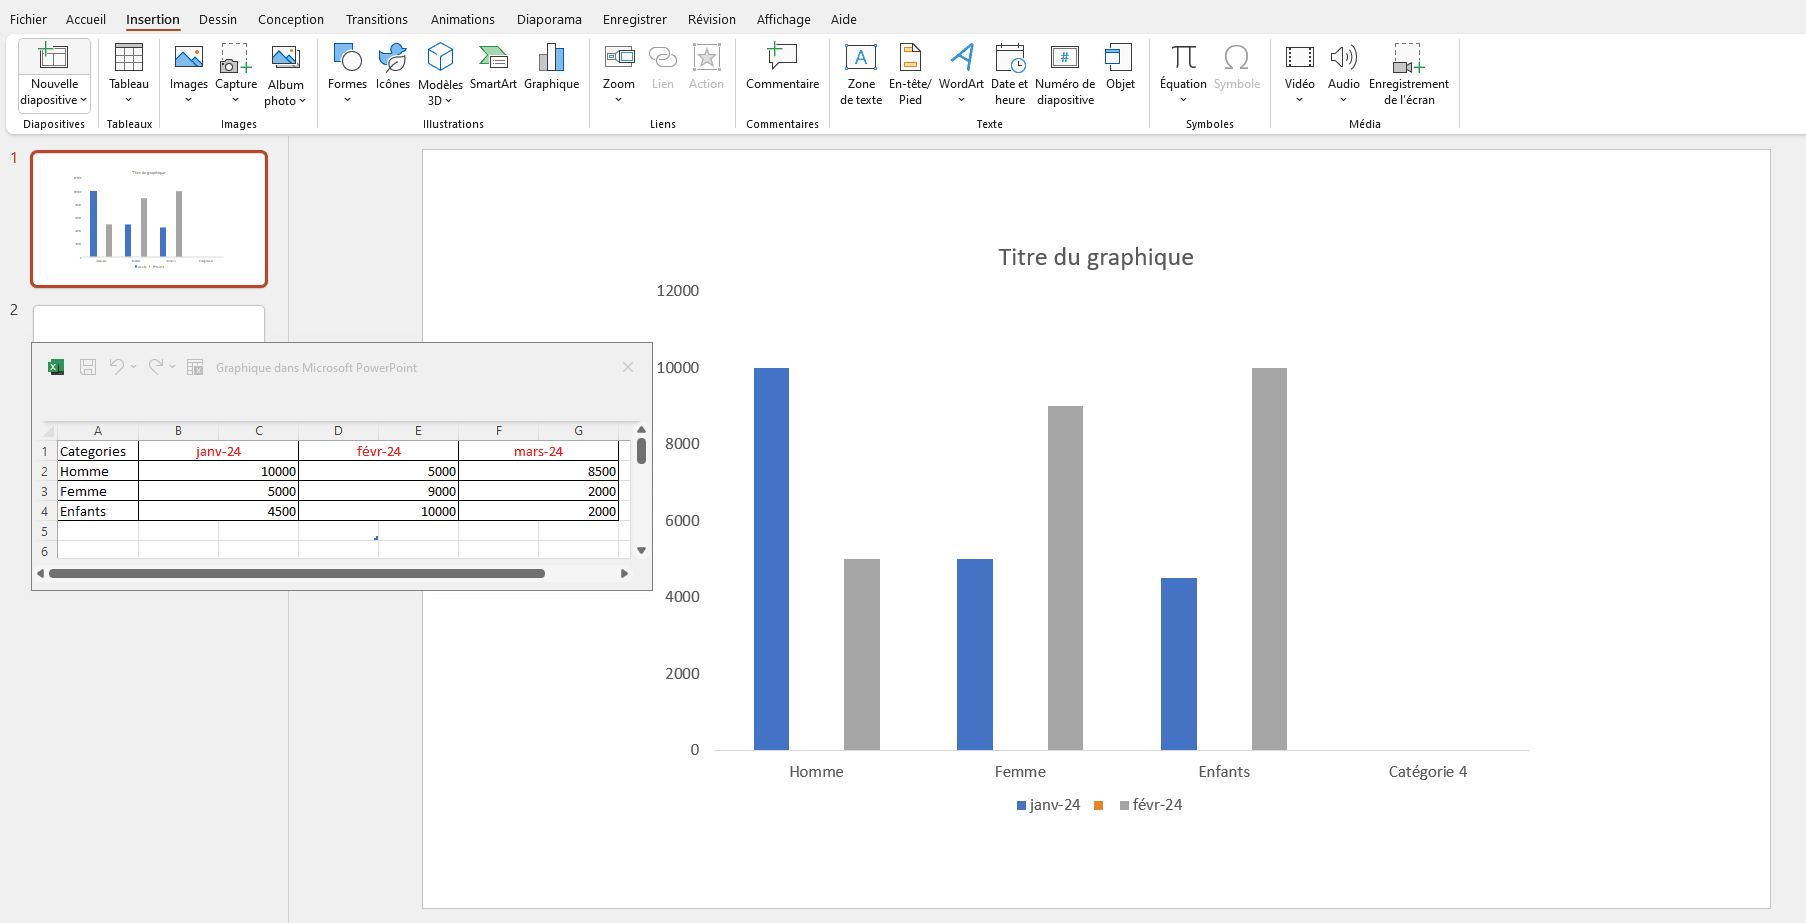
Après avoir inséré un graphique, vous verrez une feuille de calcul Excel intégrée dans PowerPoint. Saisissez vos données dans les cellules. Le graphique sera mis à jour automatiquement pour refléter vos données.
3. Modifier un graphique
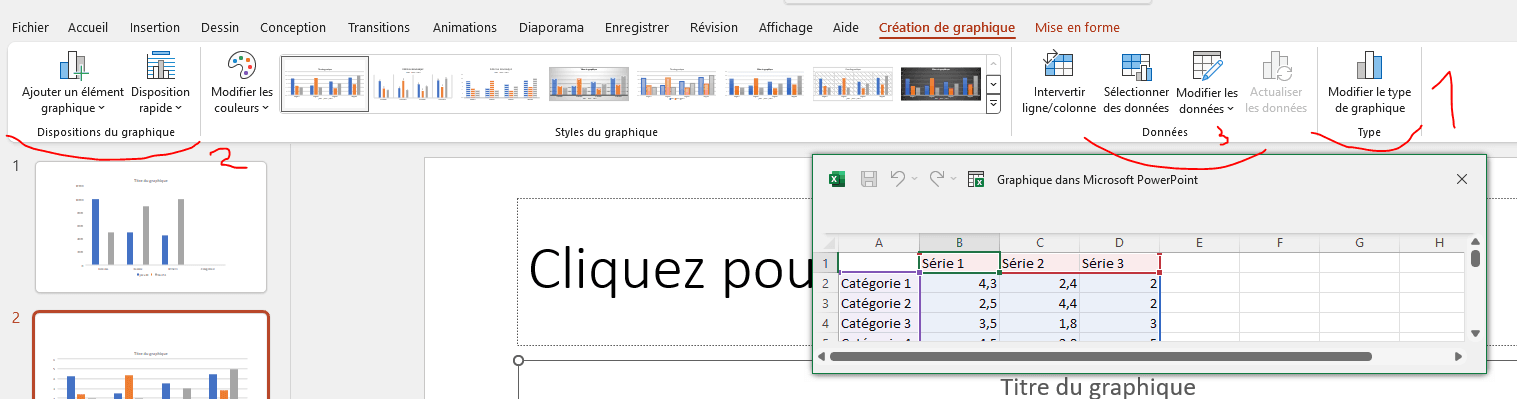
Pour modifier un graphique, cliquez sur le graphique pour le sélectionner. Vous verrez alors des options de modification dans le ruban, dans l’onglet « Création de graphique ». Vous pouvez modifier les éléments suivants :
- Type de graphique (1) : Cliquez sur « Type de graphique » dans le groupe « Types de graphique » pour changer le type de graphique.
- Disposition et style (2) : Cliquez sur « Disposition » ou « Style » dans le groupe « Styles de graphique » pour modifier la disposition et le style du graphique.
- Données (3) : Cliquez sur « Sélectionner les données » dans le groupe « Données » pour modifier les données affichées dans le graphique.
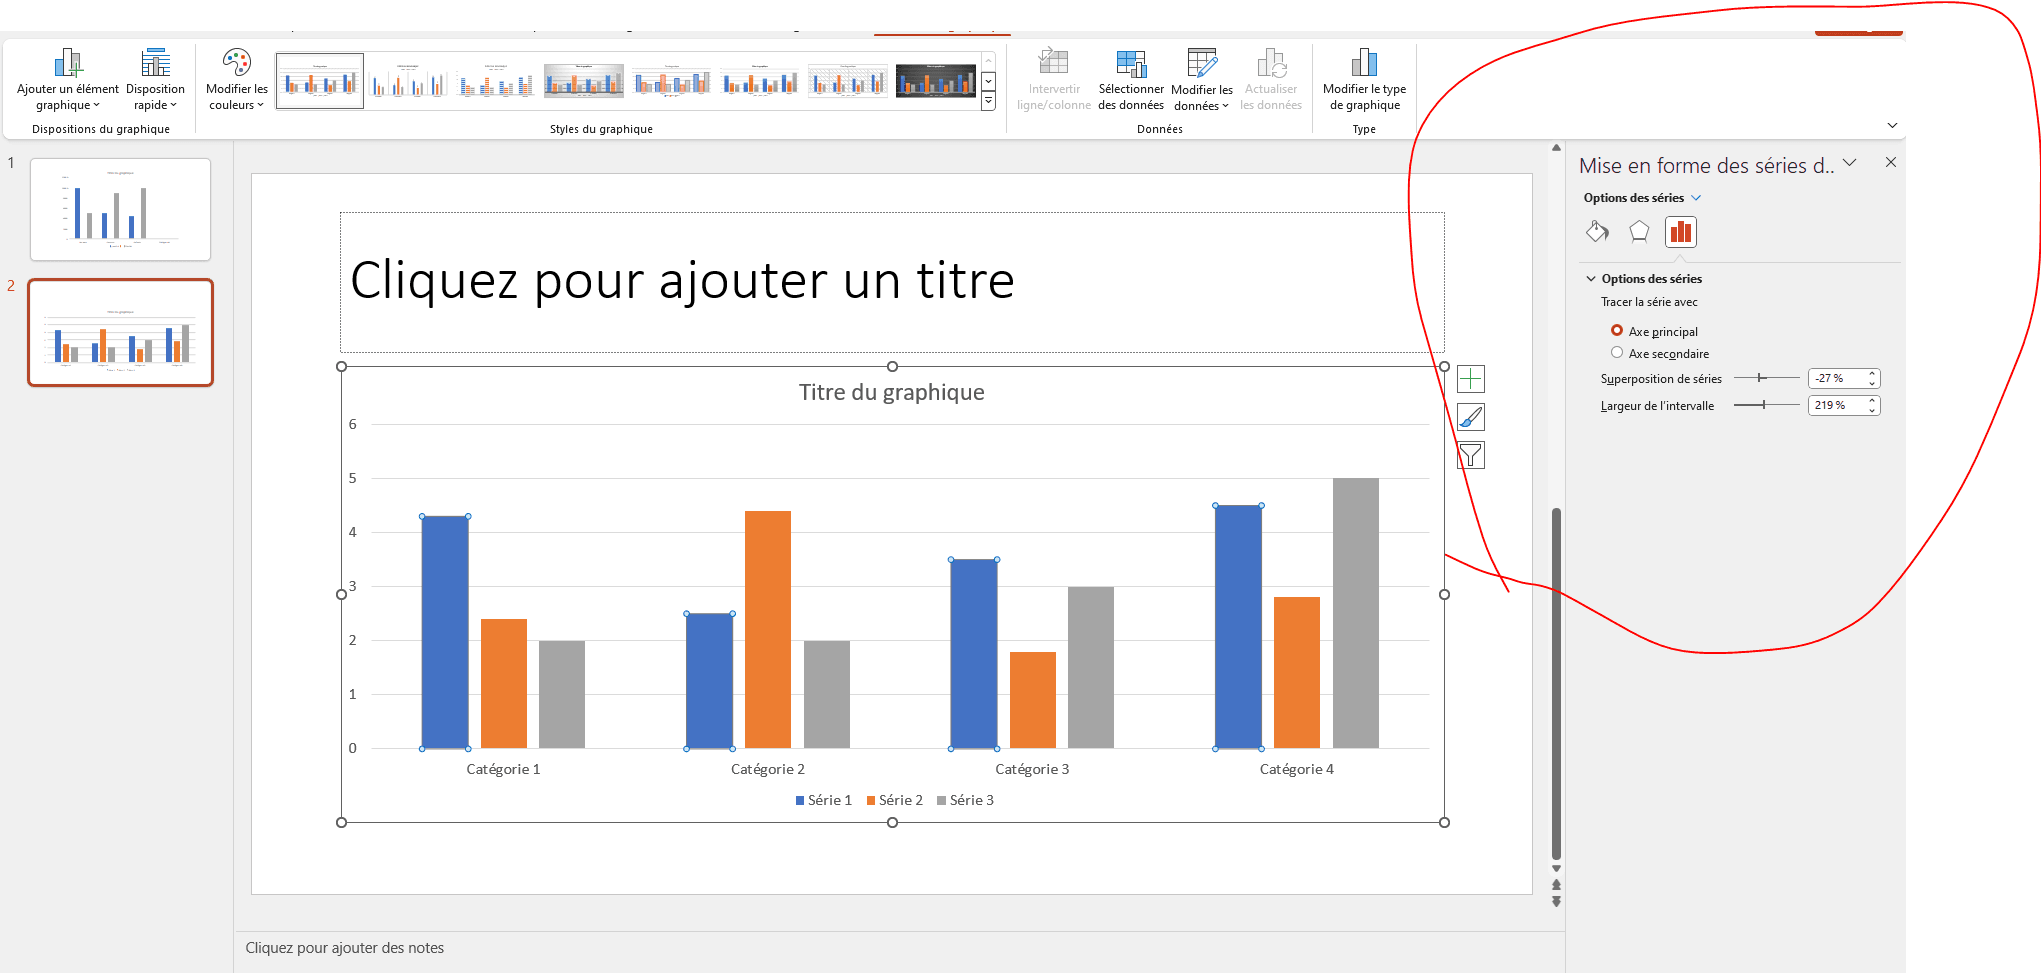
- Options : Cliquez sur « Options » dans le groupe « Options » pour modifier les options avancées du graphique, telles que l’axe, le remplissage, la bordure, etc.
4.Insérer un tableau
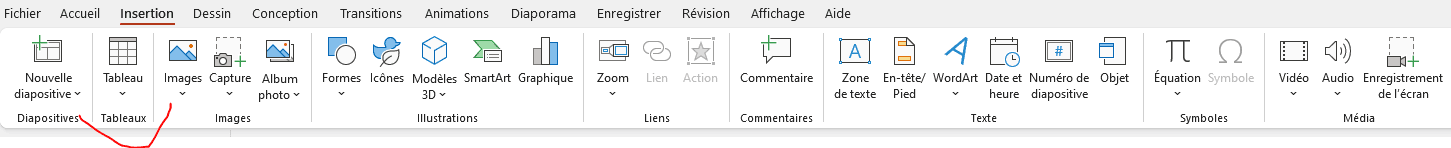
Pour insérer un tableau, cliquez sur l’onglet « Insertion » dans le ruban, puis sur « Tableau » dans le groupe « Tables ». Sélectionnez le nombre de colonnes et de lignes souhaité pour votre tableau.
5.Modifier un tableau
Pour modifier un tableau, cliquez sur le tableau pour le sélectionner. Vous verrez alors des options de modification dans le ruban, dans l’onglet « Création de tableau ». Vous pouvez modifier les éléments suivants :
- Style : Cliquez sur « Style » dans le groupe « Styles de tableau » pour modifier le style du tableau.

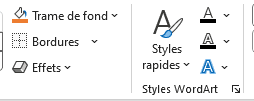
- Couleurs et traits : vous pouvez aller sur styles wordArt et choisir un style rapide ou encore des couleurs pour le thème.
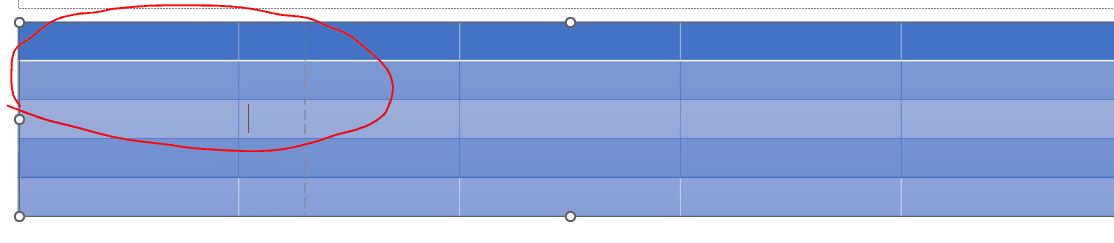
.Vous pouvez aussi modifier la largeur et la hauteur de la cellule en sélectionnant la cellule et en la glissant de haut à droite.
En suivant ces étapes, vous serez en mesure de créer et de modifier des graphiques et des tableaux dans PowerPoint pour présenter efficacement vos données.
In this tutorial, you’ll learn how to create and edit charts and tables in PowerPoint.
- Inserting a chart
To insert a chart, click on the “Insert” tab in the Ribbon, then on “Chart” in the “Illustrations” group. You’ll see a gallery of chart types. Select the chart type best suited to your data.
2. Entering data into a chart
After inserting a chart, you’ll see an Excel spreadsheet integrated into PowerPoint. Enter your data in the cells. The chart will be updated automatically to reflect your data.
3. Modify a chart
To modify a graph, click on it to select it. You’ll then see editing options in the ribbon, in the “Chart creation” tab. You can modify the following elements:
- Chart type (1): Click on “Chart type” in the “Chart types” group to change the chart type.
- Layout and style (2): Click on “Layout” or “Style” in the “Chart styles” group to change the chart layout and style.
- Data (3): Click on “Select data” in the “Data” group to modify the data displayed in the graph.
- Options: Click on “Options” in the “Options” group to modify advanced chart options, such as axis, fill, border, etc.
4.inserting a table
To insert a table, click on the “Insert” tab in the Ribbon, then on “Table” in the “Tables” group. Select the desired number of columns and rows for your table.
5.editing a table
To modify a table, click on it to select it. You will then see editing options in the ribbon, in the “Table creation” tab. You can modify the following elements:
- Style: Click on “Style” in the “Table styles” group to modify the table style.
- Colors and Lines: You can go to WordArt Styles and choose a quick style or even colors for the theme.
.You can also change the width and height of the cell by selecting the cell and dragging it from top to right.
By following these steps, you will be able to create and edit charts and tables in PowerPoint to effectively present your data.